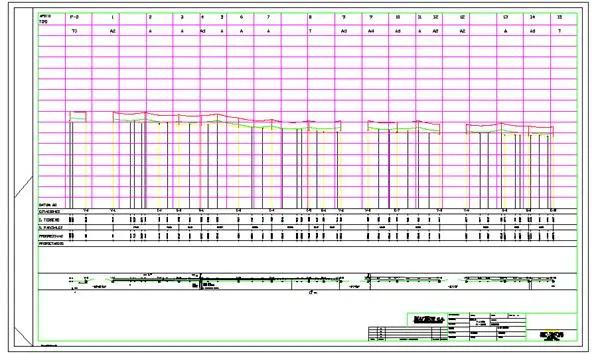
This module is to make the topographic profile map and make the poles location. It has the catenary curve to check the minimum clearence and it can check the loads in the spans. Finally it can make the reports for construction.
This system have 5 modules or subprograms to produce topography profile's drawing and structure placing
for distribution or transmission line.
The modules are interrelated through archives that allow users control and verify data in the
different process stages.
The process in general is indicated in the Figure # 1.

Following a small description use of each programs required in the process:
- Field Input Data (now can be imported from electronic device)
- Field data Calculation (progressive and levels)
- Data preparation for CAD drawing
- Profile: Automated profile drawing
- Sag and tension, to check mid span with Structures Allowable Spans
- Structure placement (manually using CAD automated drawing aids)
- Span lengths and structure loads reports.
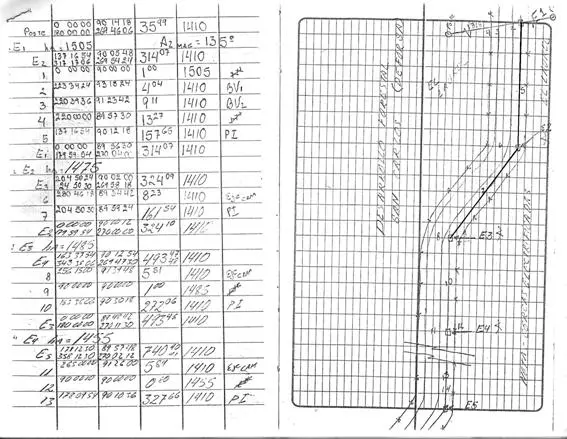
I.1. SURVEY FIELD DATA ENTRY MODULE ( CAPTOPOD )
The process begins with field topography Tacheometry notebooks. This must be carefully elaborated
by the topographers and according to the standards, paying special attention of
the following items:
- The stations must be verified forwards and backwards and with double measurements.
- In case theodolite is used the method of the three threads is requested.
- The number of the station could NOT be repeated in all the line and the names will be 4 characters max.
- The identification of the booms or filling points will be maximum 4 characters. It is recommended to use the numbers from the 1 to the 1000 and to restart from 1 as long as it is not the same station
- The booms or points of filling will be used as aid in the drawing strip, more filling point equals a better drawing generation.
Tacheometry notebook will be introduced to the computer with the Field Data entry module named CAPTOPOD. Once data have been introduced, it can be reviewed and may be corrected with the aid of any text editor. (modern equipment may export data directly)
Program CAPTOPOD generates a file with the data and name selected by the user. This file passes to the next step using the following module
At the end of these introduction is an example of Field Data tacheometry notebook, with data. New Electronic device can export data directly CALTOPO
I.2. CALCULATION PROGRESSIVE AND LEVELS ( CALTOPO )
The CALTOPO program takes the field input data and makes all the calculation to produce the progressives and levels. The program generates another listing that must be verified in order to detect possible field errors.
The maximum error of forward and reverse measurements must be check withing precision criteria established in client's standards
I.3. TOPOGRAPHIC PROFILE DRAWING MODULE (RECAD & PROFILE)
Once progressive
and the levels have been calculated the data is ready to generate the maps in
CAD using the Topographic Profile Drawing Module.
This module
consists of two programs the RECAD that must be executed immediately after the
CALTOPO and which prepare de data to use by CAD
Program RECAD
will generate one file to produce a large map or optionally many archives as maps
required by the line topographic profile drawing. The name of these archives
will be RECADXX where XX are correlative numbers.
Until this
moment all the programs are executed under Microsoft DOS. Although the programs
have direct access in windows desktop that can be executed directly by double clicking
it.
When archives
RECADXX are obtained, we need to start CAD and user may select "PROFILE"
from the upper menu. The program is loaded and executed.
When the Profile
routine start, it will ask for the location and name of each file RECADXX,
produced by previous steps. With new CAD Versions, the completed line can
be fitted in just one file.
The program will
automatically draw the topographic profile as well as the filling points that
will serve as guide for manually plan strip drawing.
The map strip will be drawn manually following the filling points.
Until this point
the topographic profile drawing is finished from now on it is come to place the
line supports.
I.4. I SUPPORTS LOCATION MODULE ( COLEST & CATE )
Previously the
engineer must calculate the running placing parameter, height and average span
of the line supports.
For example for
a 13.8 kV line, in a 35 foot pole, with 4/0 AWG Aluminum conductor have a mean
span length of 360 foots and would have a 1100 parameter
With this data,
the placing of line supports can be made using minimum clearance aided with sags
curves. In flat terrain the predominant criteria for the location is the average
Span and is as follows:
- First all supports on angles are placed obligatorily
- If the distance between poles is greater than mid span (360 foots ), supports are added so to keep spans between angles uniformly separated.
- Engineers must verify that the supports are not located in a terrain that prevents their construction, as well as the presence of natural obstacles, rivers, etc.
In mountainous terrains
supports are placed in the highest points and then average Span criteria could
be used to place the others supports, verifying to complaint with the minimum clearances
using the Catenary's curve at the same time. Note that catenaries curves are drawn
automatically by this module.
The supports are
drawn with the help of routine COLEST and COLEST2 which assure the correct
position and scale of the support.
After locating
the poles or structures routine CATEEX is used to exactly fit the catenar's to
located poles.
SPAN program and
POLE finally make automatic demarcation on poles and final span length, in the
drawing strip.
If the line is rural type, subscriber could be identified using program IDENABO.
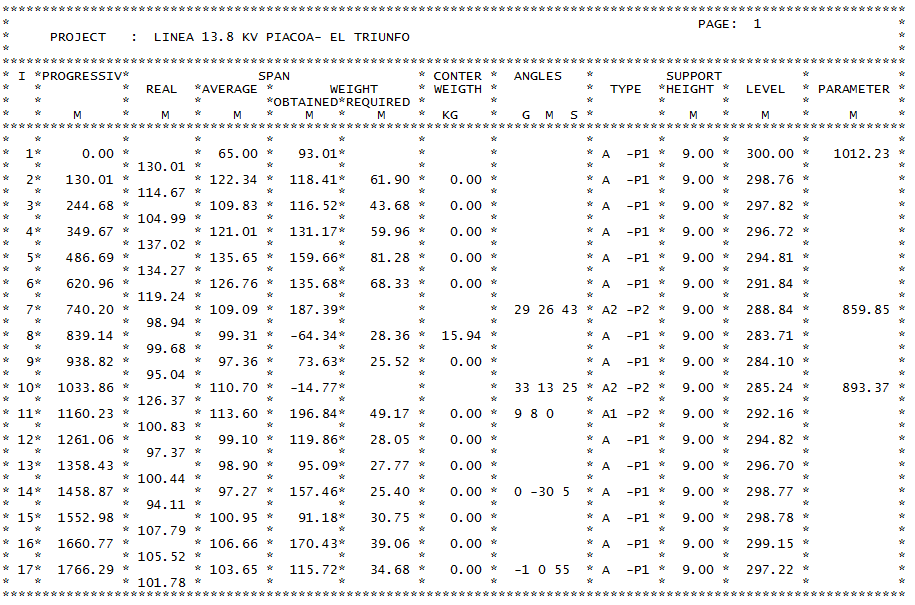
I.5. SPAN LENGTHS, STRINGING CHART AND SUPPORTS REPORT
This module is
in charge to calculate and to summarize the results of the definitive structure
placing of the electrical line. Has two parts, one to be used inside CAD to
collect de data, and the other in Fortran to makes the calculations and
reports.
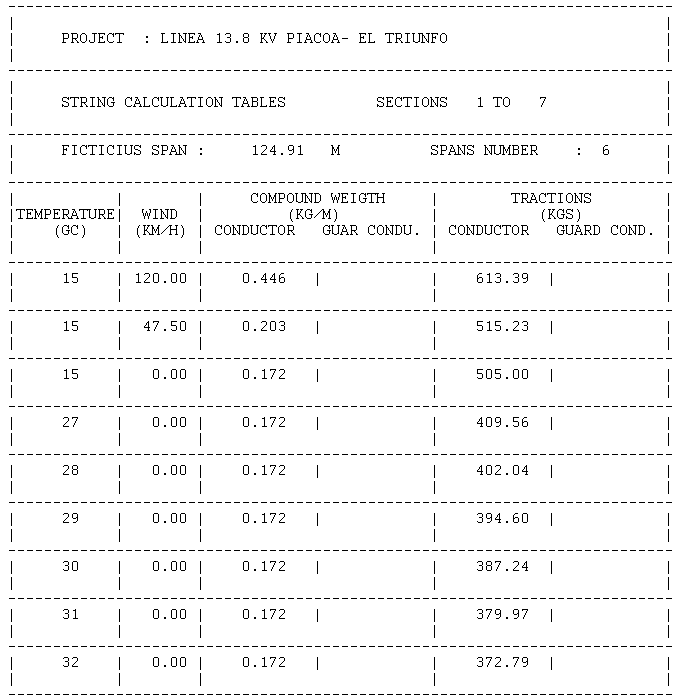
Routine TENFL is
executed to take the data from the drawing with the definitive location and to
verify the average, real and ruling span of each lines supports.
Program TENFL (
CAD ) generates the data file with progressives and levels and height of
structure from the drawing and produce a data file, then another module TENFLE in
D.O.S. FORTRAN ( using Windows ) will read de data from file, make the
calculations and generates the Final Report and stringing chart.
In this SUMMARY real
span average and running span must be verified again, in order to verify that
they do not exceed the mechanical structure design limits and also to verify
the definitive placing parameters. If the resulting parameters are very
different from the used placing, it is advised to reconstruct these catenaries curves
again in order to verify if there are problems with minimum clearances.
I.6 EXAMPLES
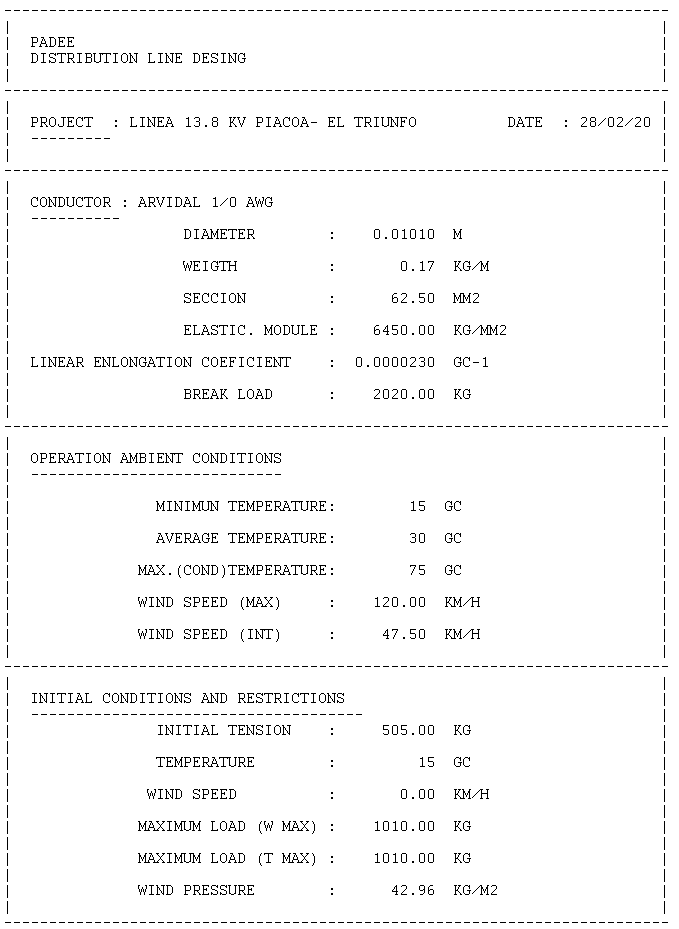
Following are some project reports examples.
Final Drawing
Summary Reports