
This Software takes the electric data directly from distribution real feeders maps in CAD and analyzes them. Run a load flow analysis placing the results directly on maps automatically and interactively.
This Tool is for Designing, Planning, Operation, Maintenance and loss reduction in feeders. It is mostly used by utilities and consultants who work in Electric Power distribution Systems. It links the medium voltage, low voltage and customers data under an integrated and common system. Its Ideal for Spatial Load Forecast. Data can be exported to several output formats and also can be imported from ArcGis (Esri)
PADEE has been running since 1992 !. Today works on Win 10 or Win 11 X64 & AutoCAD up to 2026 or Bricscad V26, proven to be the best solution to power distribution analysis
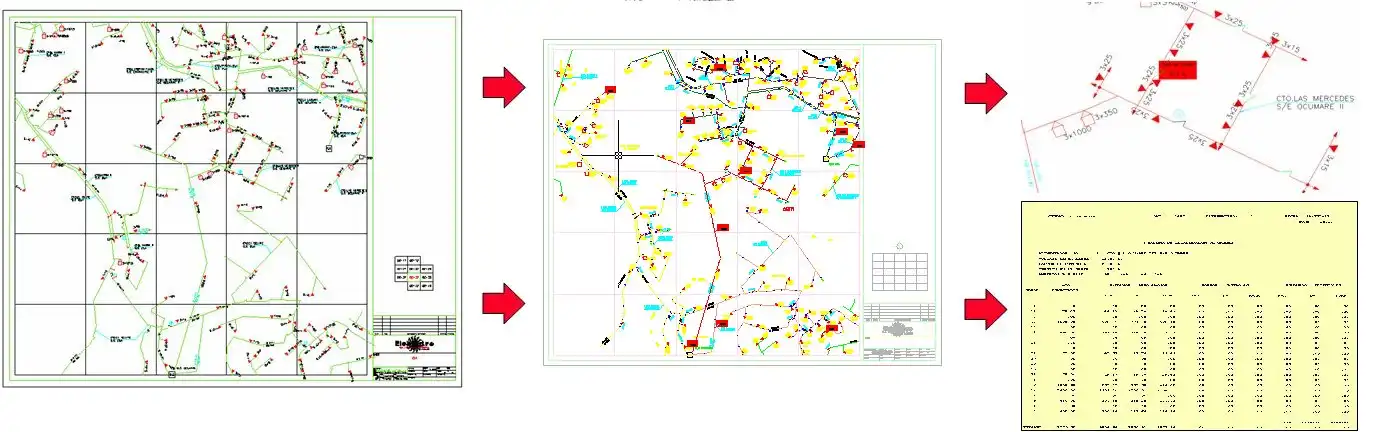
PADEE uses maps drawn in CAD and with special blocks, libraries and database, produce a Geographic Information System (GIS), Or Distribution Data System Management (DDSM), being very useful to handle the large amount of data, commonly needed in distribution networks simulations. It also links all the data forward and backward from the customer, up to the medium voltage substation, to make energy balance and technical & non technical energy loses calculations
Here are some specific examples of how PADEE 2026 can be used to improve the performance of a distribution network:
The user´s manuals guides through all stages; from information pickup or inventory all the way to the load flow analysis and Projects elaboration. It should be mentioned that ours users are our main software salesmen.
PADEE Explanation Details and prices
Get a Power Point Presentation
Some Interesting Equipment Photos
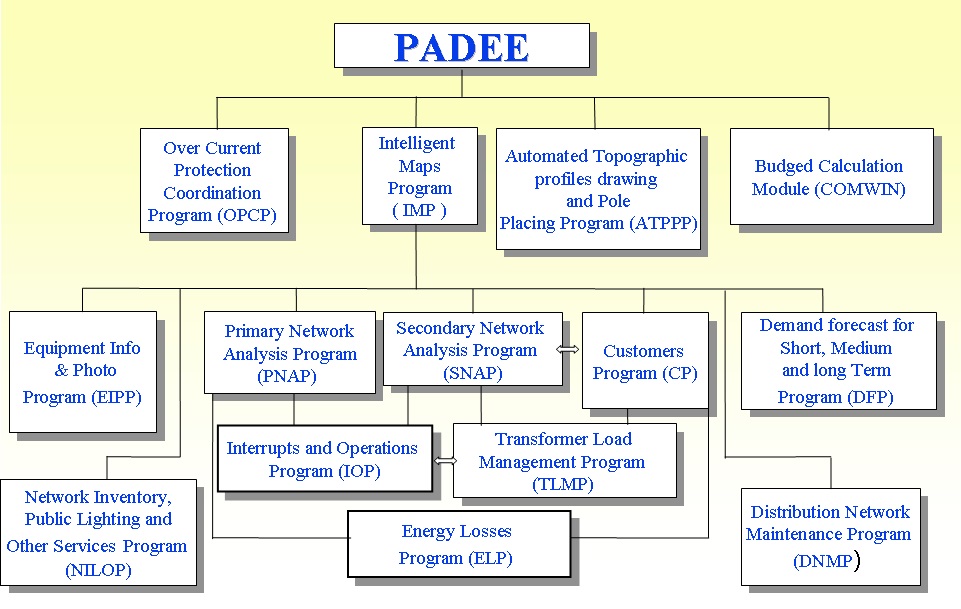
Intelligent Maps Program (IMP), contains standards to make a "smart maps" withing CAD. These programs help users to draw maps systematically and standardized, to easily find and submit the data automatically to the analysis programs. It consists of automated libraries, map drawing's aids and user's manuals. It's the data base to use GIS technology and easily location network elements in the map. PADEE may import Electric Network data from ArcGis.
Primary Network Analysis Programs (PNAP), it calculates voltage drop, losses, short circuit levels and reactive compensation optimization on medium voltage feeders. It has intelligent algorithms to build the feeder's topology based on the graphic conventions or drawing standards without the intervention of users. There is a demo video on this link PNAP Demo Video
Secondary Network Analysis Program (SNAP), makes calculations of voltage drop, losses and load flow but for low-voltage distribution network. It also creates additional files to link the customers with it's transformer bank. Very useful to know customers affected by services disruption when parts or all feeder have an outage. See a demo video on this link SNAP Demo Video
Customers Program (CP), allows the connection of customers or subscribers to the structures of the electrical system, allowing to obtain the billing data (energy sold) located at each point in the grid. It also works as an information system to support the customer's location applications, claims, meter reading collection routes analysis, energy consumption characterization analysis by zone types, and others. It use data from the central customer database.The data can also can be used for Spatial Load Forecast
Transformer Load Management Program (TLMP) has dual function, one is summation of energy served by a transformer bank, then the total energy is converted into demand and get load levels vs the maximum capacity, resulting in an important distribution transformers loading monitoring (TLM) in banks that have no other measurement. The other function is let the engineers input a demand measures recorded in the field to verify or establish the conversion factor energy-demand. This option allows a very important analysis for the detection of non-technical energy losses, because it allows comparisons between the billed energy with the theoretical energy dispatched by each transformer's banks.
Equipment Information and Photo Program (EIPP) This module allows linking any map's element to a multimedia file. For example equipment's photos, measured records, thermo vision videos, detailed diagrams, other one-line diagram in other CAD files, etc. It also brings Google or BING maps to get a view of customers type served by the network.SGMAP With this option users can automatically localize and visualize Maps with a click on the georeferenced Network Maps. It also copies the maps images directly into the Network Map. Users may search and locate street names, building or business in Google even though there are not available in the network map. (Since Sep-2025 Google map or Bing map requires an API key subscription). Please see the video Gmap & Gstreet. Also our Lat-lon to UTM conversion tool
Spatial Load Forecast for Short, Medium and long Term Program (DFP) This module helps demand forecast for the grid. Takes the load of regular areas, totalizing the demand for distribution transformers of each regular area and produce an Excel file with the spatial loads. The load for each regular area are processed with Excel using whatever mathematical analysis of demand forecasting you prefer, then performs the reverse process; After the mathematical analysis produce the forecast results, the values are incorporated into the network, for each regular area in proportion to the installed capacity. The Users Manual presents a typical example using "Land Use Based methodology" to calculate demand forecast, but users can developed other methods with the help of this module. The resulting demand file per regular area can be read by Microsoft Excel or another spreadsheet, allowing the user to perform any calculation or using any kind of extrapolation formulas.
Overcurrent Protection Coordination Program (OPCP) This module is a tool to draw log-log curves for overcurrent protections coordination. Contains a series of data curves of multiple relays and fuses used for overcurrent coordination, plus the electronic relays. It has special help tools easily make One-Line diagrams of the system associated with protection study through automated libraries of symbols, and also has simple short circuit levels calculations of the portion of the systems being study.
Automated Topographic profiles drawing and Pole Placing Program (ATPPP) Its function is to calculate and draw the topographic profile for power lines, it use the note book of the topographic survey and help making the drawing in CAD. It also offers all the tools, such as catenaries curves for manual placing of poles or supports structures. This module consists of several programs for each of the sub-activities performed: data capture module of the surveyor's notebook, module for making the calculation of the notebooks, drawing module topographic profile, placement of structures, drawing catenaries,customer ID, Automatic Data Collection for the road location, and program for calculating weigh, medium a factitious span, sag and tension resulting from pole placing. For more information visit ATPPP detailed information
Budged Calculation Module (COMWIN) It has been working since 1985 and was upgraded for Windows and multi-user enviroment. The system helps budgets, analysis of unit prices, valuations of inventories of electrical works.
Interrupts and Operations Program (IOP) This module simulates the transfer of loads when there is a maneuver in the network. It has the tools to quantify the interrupted load during an operation or maneuver and can identify exactly which customers are affected by an interruption. The system stores the outages and can provide the total interruption time (TIT) or the total KWH interrupted. Presents the length of lines affected and interrupted installed KVA in distribution transformers affected.
Beginning on Feb,25th 2008 a new option in the Operations and interruptions Module (Switching and Contingency), Distribution Operation Controllers (DOC) can mark the unavailable Switches and cutouts reducing the outage time with an operations that can't be executed. This option was made at the request of Carabobo DOC users. This modules is also showed in PANP Demo Video
Energy Loss program (ELP) This module allows the detection of non-technical losses, making the comparison of the energy dispatched by feeders and billed energy. It presents various types of calculations and results depending on user needs, such as circuit losses for micro areas, macro areas, etc. Calculate total energy losses, taking into account the total energy imported to the system and the energy sold. It also produces a complete summary of network elements, such total of transformers, circuit length, etc. Energy Losses demo Video
Distribution Network Maintenance Program (DNMP): This system keeps a record of all the maintenance work done or to be done. The statistics of work carried out in a period of time, can determine whether the maintenance work are becoming more frequent compared to earlier periods, and indicate the need for a massive change of some elements in the distribution system. The system allows the identification of planned maintenance work without need to be done.
Network Inventory, Public Lighting and Other Services Program (NILOP): This module makes pole inventory database for the electric distribution network, improving the knowledge of the network and provision of purchase of components and materials. Additionally allows discriminate the supports being used by other utilities such as communication services, Cable Tv, lighting and advertising signs.
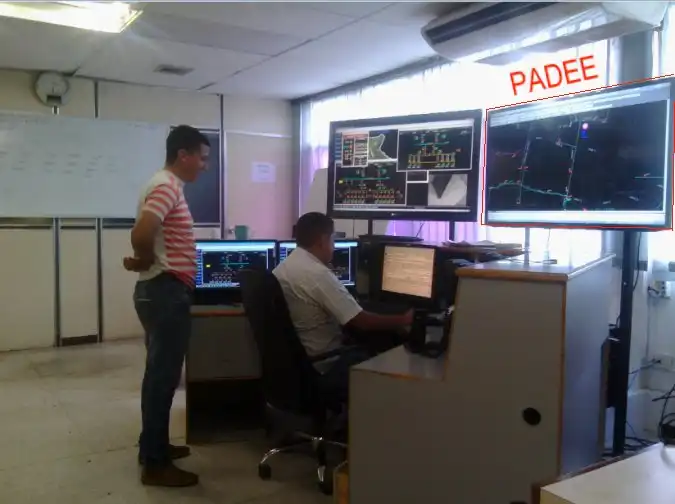
The PSCADA module, visualizes and operate the feeders Switches in line and from the MAP in CAD. Also it can read substation and feeder demands. There is Paper that can be downloaded that shows the Viewfinder software that link the remote measuring device with the PADEE Paper ViewfinderLoad V5 in pdf (211 kb)
The PUBSAT module, with GPS technology allows to visualize the location of the maintenance crews.
The PATOTE module, visualizes the totalizers meters installed in the network to discover nontechnical losses
The PPTEIS module, calculates the technical losses and to summarize all the information of the network required by official departments
The PFALLA module, that visualizes the geographical place where a system fault was recorded and can be presented filtered by different criteria scope.
The PACREC module, which visualizes the faults affected users and help to locate the failed equipment in order to reduce system downtime.
Medium Voltage Network Analysis, Operations & Equipment info. 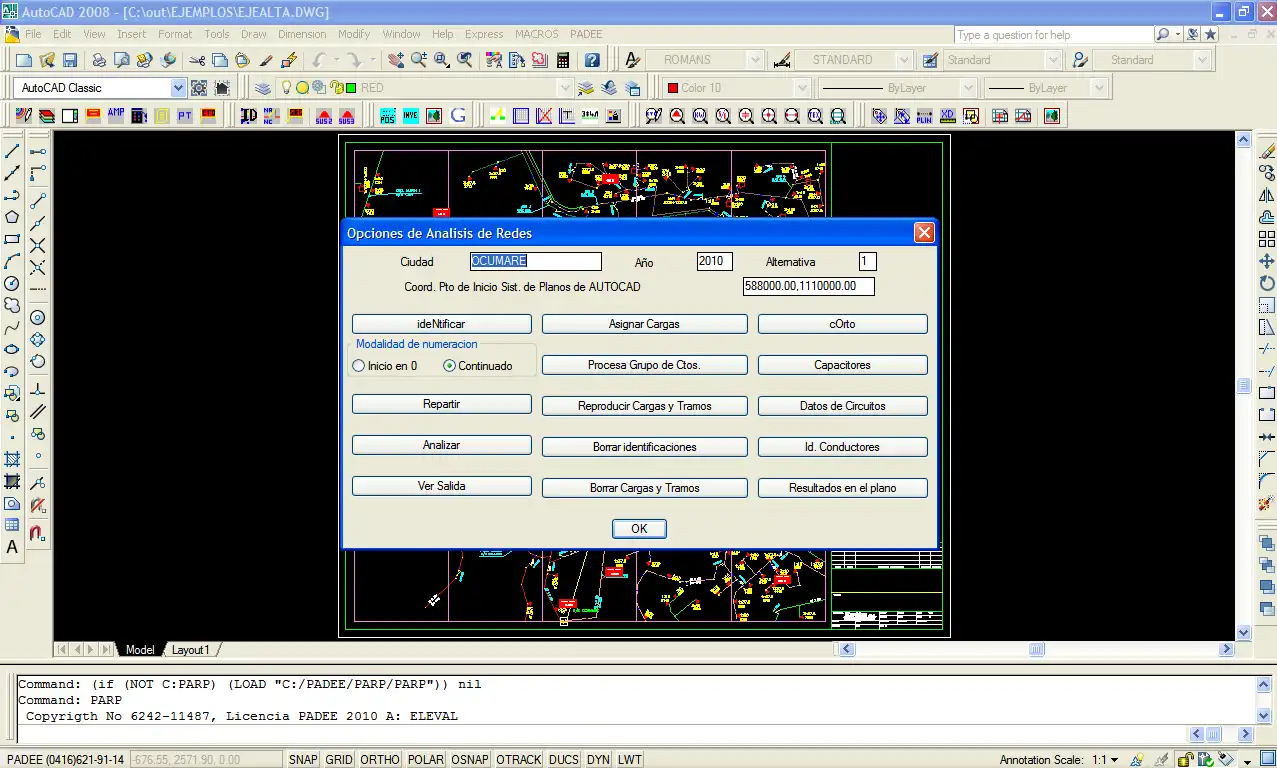
Low Voltage network analysis & Customers info 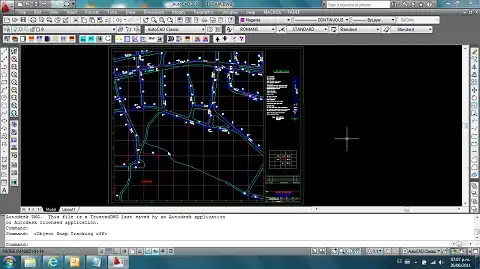
Energy Balance & Losses Reduction Analysis 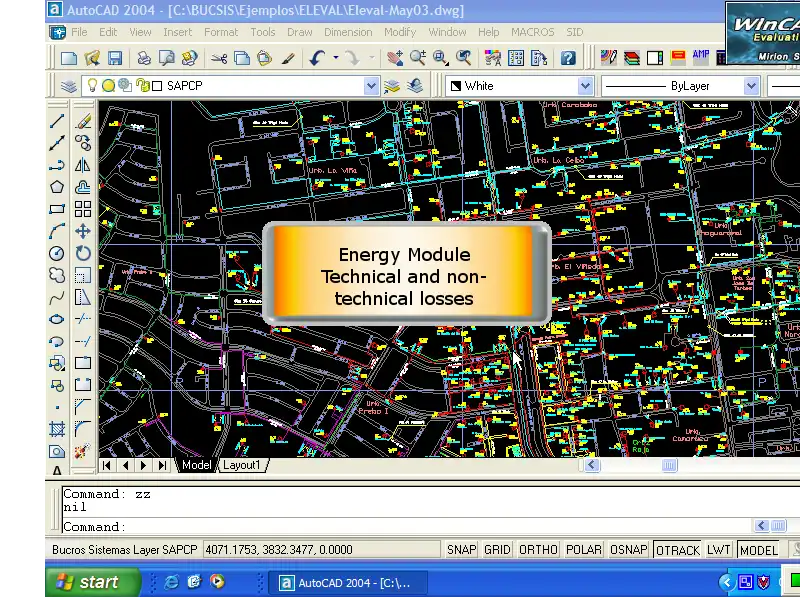
Medium Voltage Network Analysis (BricsCad) MP4 
PADEE carries out all the necessary tasks for planning, designing and operation of Electrical Power Distribution Systems. Works with Autocad version from 2006 to 2026 or BRISCAD V26 and Windows 10 or 11, being indifferent which version is used. However is to remind that newer versions require faster computer hardware and higher memory size.
The recommended operating systems are Win 10 and Win 11 32 and 64 Bits. Windows XP, Windows 7 still works but there are not recommended for new users also the Google and Bing Service is not compatible anymore. Older Windows versions: win98, 2000 or Windows NT supports, was stopped in 2008.
The PADEE users manual have tutorials and aides to help it uses from starting the maps to the final analysis and future configurations. It has friendly menus and error messages helps that advises users on how to avoiding them. In the following address you can download the up-to-date Frequent questions Asked manual Frecuently Asked Questions
COMWIN for budged application can be installed on a server, sharing the main database with all company users.
To get the best performace needs updates No 641, 644 & 645 for CORPOELEC nation wide licences.
The first version of the PADEE was available on April, 13th 2006 and it improves and completes the old version (SIDMAT 1992-2006). At the moment the PADEE is available up to Autocad 2026 and its Architectural, Mechanical and MAP versions, Briscad V24
In order to install the PADEE in a newer CAD version, you need to execute the c:\padee\autocad\INSCADPA.EXE installer. The same procedure is needed when another User wishes to use the PADEE in the same PC with Windows XP. In Windows Vista and newer the same USERKEY will need to be introduce again for other users in the same PC.
The "UPDATE" option, allows the maintenance and automatic update of all the programs. Users only need to execute the application, it will verify available updates and download it automatically to maintain software running smoothly.
All together there are about of 500 seats with this software
Frenquently Asked Questions
Recomended LINKS:

All the PADEE material included in this web page and its links are copyrighted © to Jorge Matheus